A few posts ago I wrote about the mapper construction by Carlsson-Memoli-Singh (Singh et al., 2007) and now want to follow up on that a little.
I wrote a straightforward implementation of the construction in Python. It can be found here: github.com/mirkoklukas/tda-mapper-py.
Example Usage
from tdamapper.clusterfunctions import VietorisRipsClustering
from tdamapper import mapper
from tdamapper.referenceMap import create_functional_cover, coordinate_projection
import json

# Example data set
with open("./example/dataset.json") as f:
    data = json.load(f);
    data = [ tuple(p) for p in data ]

# Gather the mapper input
VR = VietorisRipsClustering(epsilon = 0.6)
zAxis = coordinate_projection(axis=2, domain=data)
funcCover = create_functional_cover(endpoints=range(-12,12), overlap=0.5)

# Run the alogrithm
result = mapper(VR, zAxis, funcCover)
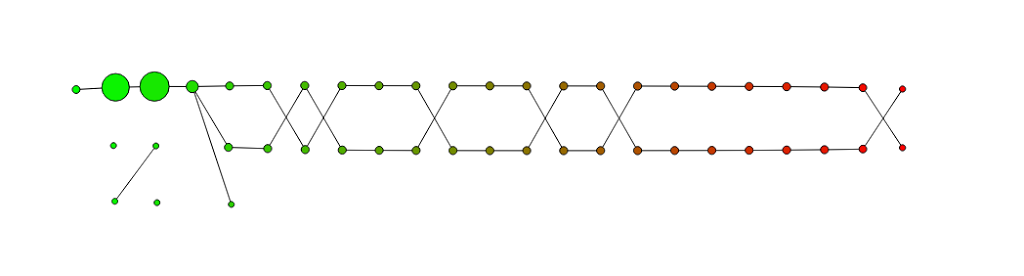
Below you see a visualization of the mapper result. The graph is colored by the values of zAxis , the projection on the z-axis. The size of the nodes reflects the size of the associated clusters.
The take away should be that there are actually two separate branches growing out of a bigger cluster. You shouldn’t focus too much on the fact that the two branches cross each other. Although it reflects the reality of the situation pretty well, it is rather a bi-product of the fact that I used very simple data set in so few dimensions, and that I was too lazy to reduce the number of the crossing in the graph.
And indeed (what a terrible example it would have been if that was not the case) looking at a 3d plot of the original dataset we see that this reflects the shape pretty well.
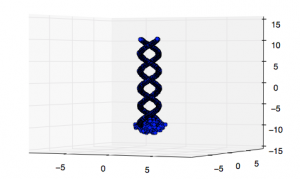
Again: it’s the two branches that matter, not the crossings, I chose a misleading example and really should update that in the future.
References
- Singh, G., Memoli, F., & Carlsson, G. (2007). Topological Methods for the Analysis of High Dimensional Data Sets and 3D Object Recognition. In M. Botsch, R. Pajarola, B. Chen, & M. Zwicker (Eds.), Eurographics Symposium on Point-Based Graphics. The Eurographics Association. https://doi.org/10.2312/SPBG/SPBG07/091-100